Using and Navigating Billing Analytics
Logging into the eSquared Customer Portal
1. Go to http://www.e2cc.com/ and click on login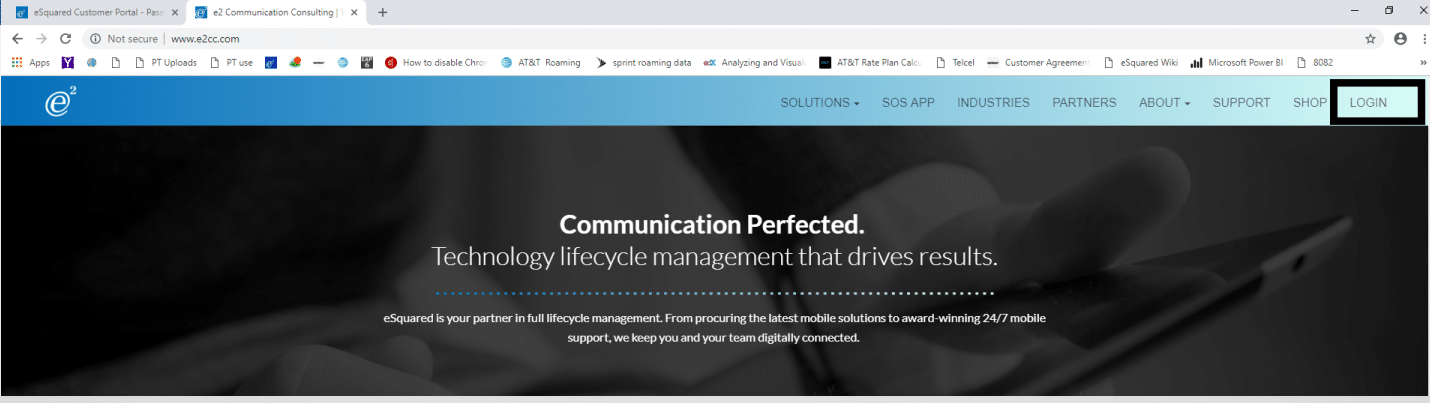
- Enter email address, followed by username and password. If having difficulties logging please see here for help: https://kb.e2cc.com/knowledge-base/esquared-customer-portal-password-reset/
- Once in the customer portal, click on the Billing Analytics button to get to the analytics section

- Once there click on the file to load (note in most cases you will see one file, if multiples exist they will be labeled with which division the report is for: WMS,TMS or MTM)

Navigating Billing Analytics
All Billing Tabs will have a few common pieces
Navigation bar
Clicking on any of the icons (barring the company logo) will take you the corresponding page or pop-up menu.
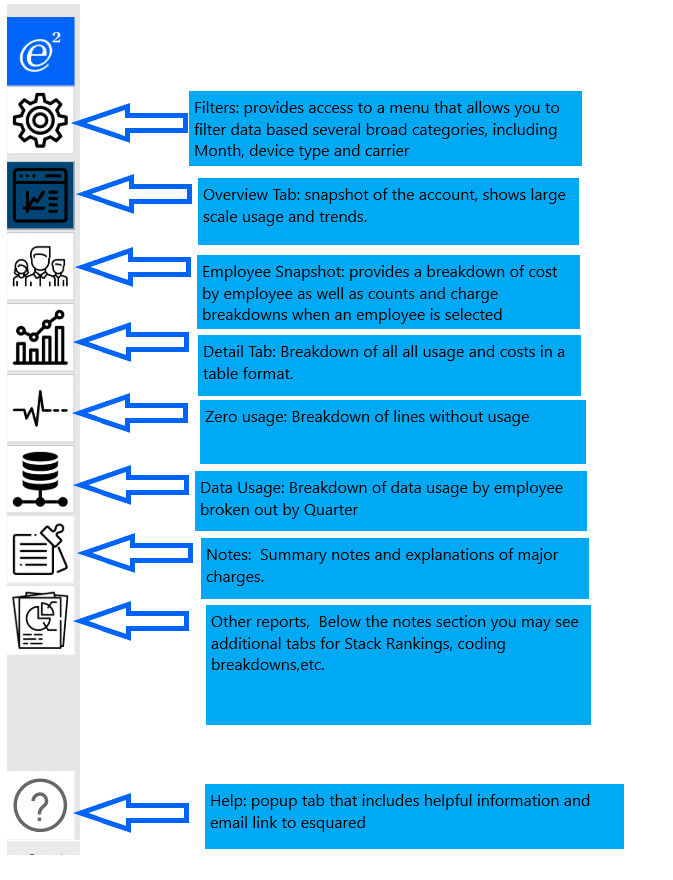

Icons in blue convey what tab a user is on.
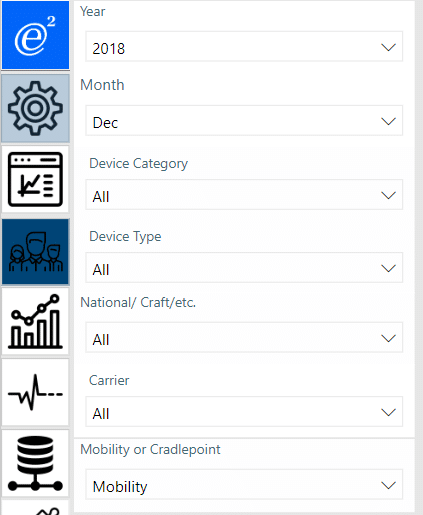
Filter Pop-up Menu
Clicking on the gear icon on any tab will display the filter menu, this allows you to focus data on a specific time period, device type or carrier. Clicking on the gear again, will cause the menu to close,
Help Pop-up Menu
Click on the “?” icon will cause a help menu to be displayed. This menu offers a quick breakdown of the abs available along with a button to email esquared communications.
Navigating the Dataset
Each tab will have different graphs and tables but a most interactions and tools are common
Filtering via Graph or table
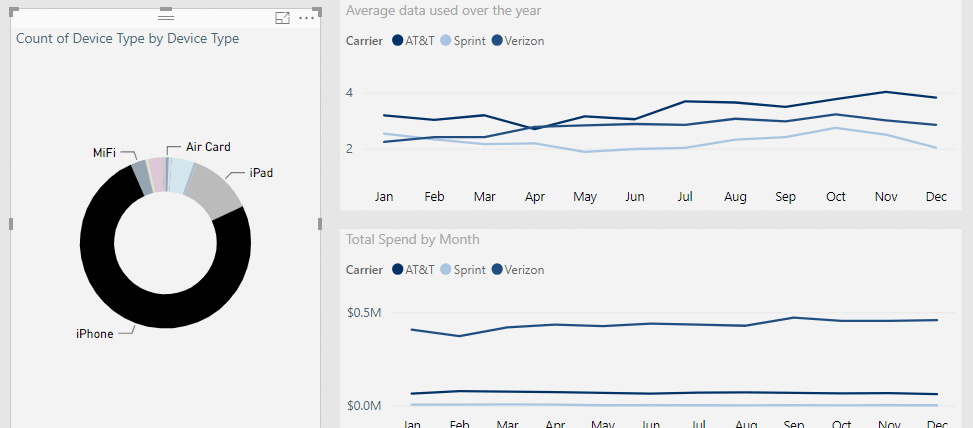
While the filter pop-up menu allows you to filter data, you can also filter data via navigation of the different charts and tables on a tab.
For Example:
If we click the section, showing the iPhone Device count on the Graph
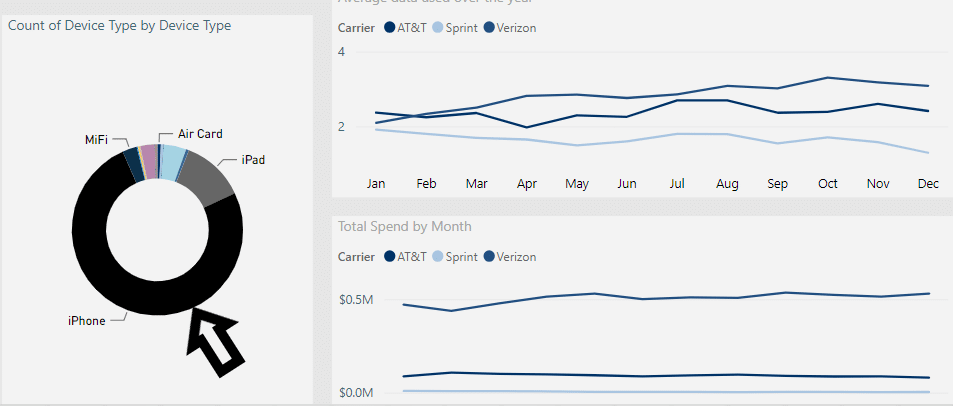
Then the Total spend and data usage charts to the left of the graph will now only show the costs and usage for your iPhones:
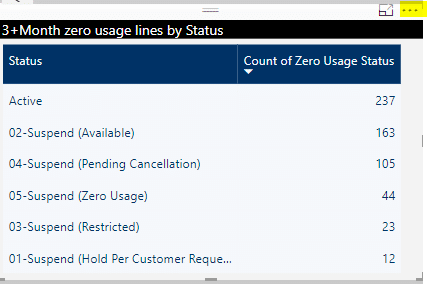
Downloading Data
In some cases, you may want to extract or download the data used in the billing analytics display.
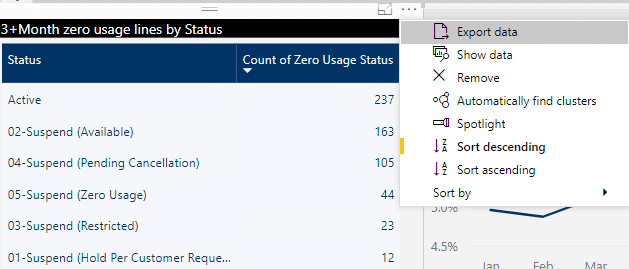
On any chart or graph, you may click on “…” to access the more options menu (highlighted yellow below)
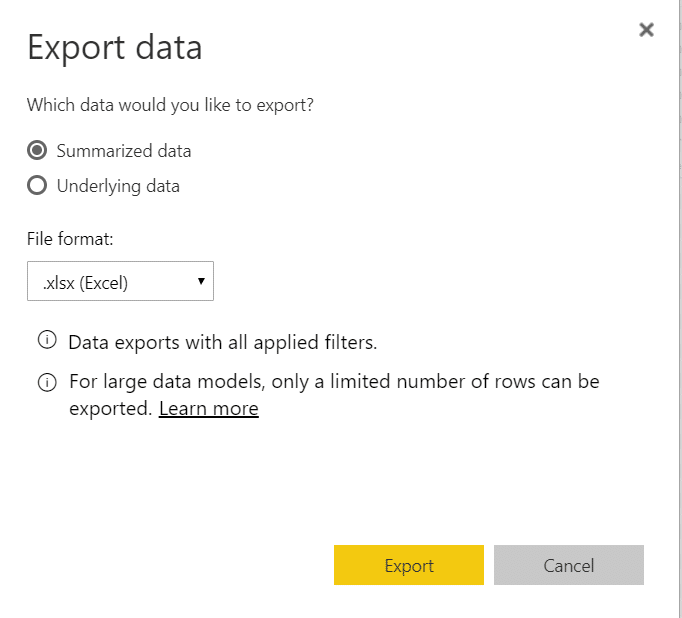
The first option will be to export data
This will take you to a menu allowing to download just the data shown or all of the data attached to the chart.
Special Tabs
Details
The Detail tab includes two features not seen in any of the other tabs:
- The matrix
Every single line is listed in the matrix
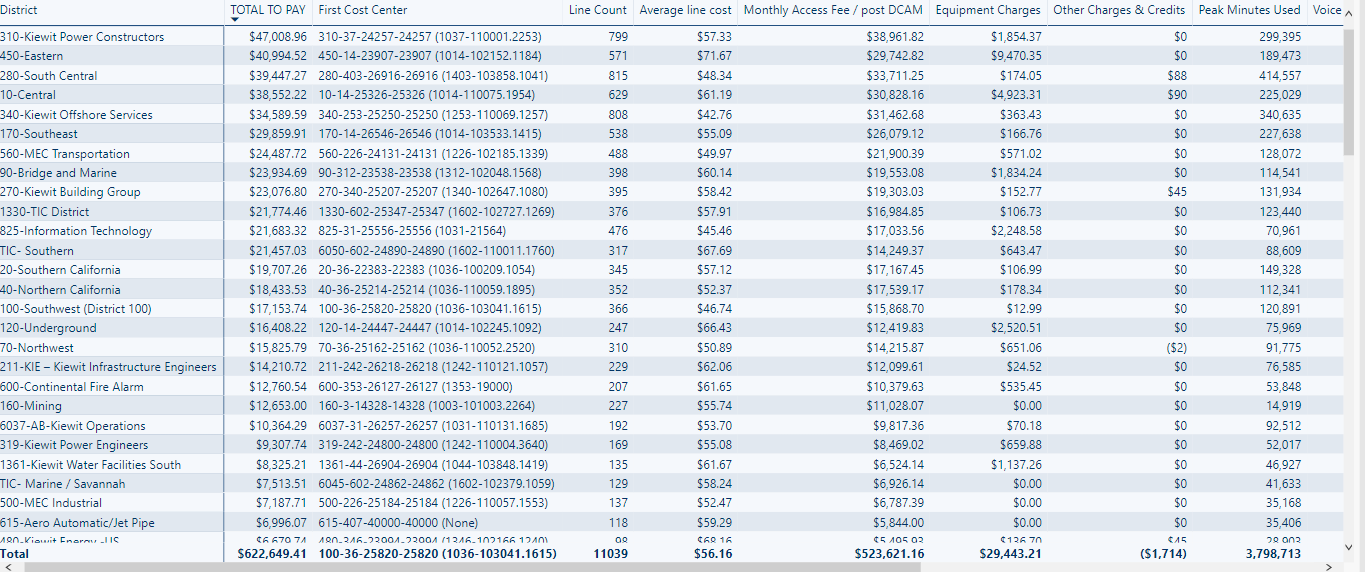
However, in most case the instead of seeing each individual line you will see a top level summary based on the departments.
To navigate these different levels you have a few ways of going about.
![]()
These three buttons allow you to go up and down the levels as needed.
However, say you want to dig deep into only a specific sub-section you can do the following:
Right-click on the row you are interested in, this will give you the following options:
Expand/Collapse: This will allow you to see go down(expand) or up (collapse) in level while still seeing the other hierarchies. You will also have 3 sub-options.
Selection: only go down/up one level of the row you have chosen.
Entire: go down/up one level for all rows
All: Go down/up to the lowest level for all groups
Drill Down/Up: Go down/up one level of the row you have chosen, also all other groups will be hidden.
Cost Code search
The detail tab also includes a cost code search which allows you to search and filter by part of or the entirety of a cost code.
[no_toc]