Using and Navigating Billing Analytics (simple)
Logging into the eSquared Customer Portal
1. Go to http://www.e2cc.com/ and click on login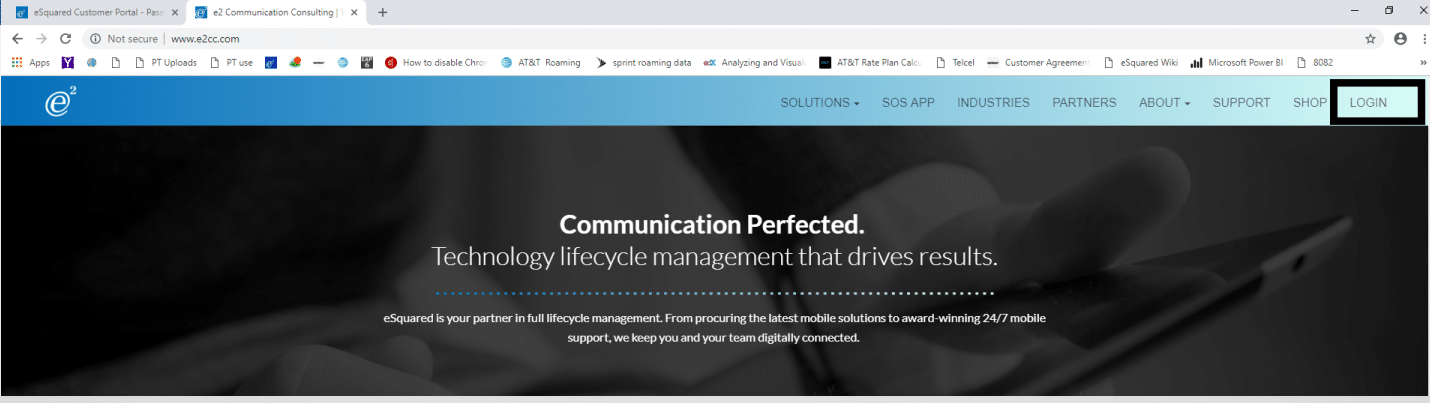
- Enter email address, followed by username and password. If having difficulties logging please see here for help: https://kb.e2cc.com/knowledge-base/esquared-customer-portal-password-reset/
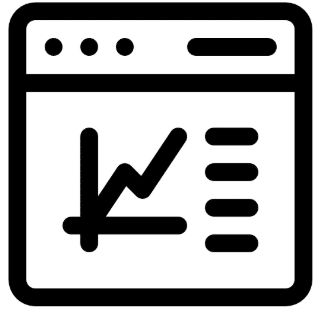
- Once in the customer portal, click on the Billing Analytics button to get to the analytics section

- Once there click on the file to load (note in most cases you will see one file, if multiples exist they will be labeled with which division the report is for: WMS,TMS or MTM)

Navigating Billing Analytics
All Billing Tabs will have a few common pieces
Navigation bar
Clicking on any of the icons (barring the company logo) will take you the corresponding page or pop-up menu.
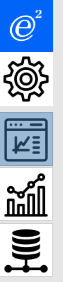

Icons in blue convey what tab a user is on.
Filter Pop-up Menu

Clicking on the gear icon on any tab will display the filter menu, this allows you to focus data on a specific time period. Clicking on the gear again, will cause the menu to close,
Overview
 Snapshot view of the health of the account, provides charts and high-level view of the account.
Detail
 Provides a breakdown of each line, similiar to the detail tab on the historic excel based reporting.
Data usage
 Provides a breakdown focusing on data used.
Help Pop-up Menu
Click on the “?” icon will cause the user to leave to the knowledge base website which includes this guide,
Navigating the Dataset
Each tab will have different graphs and tables but a most interactions and tools are common
Filtering via Graph or table
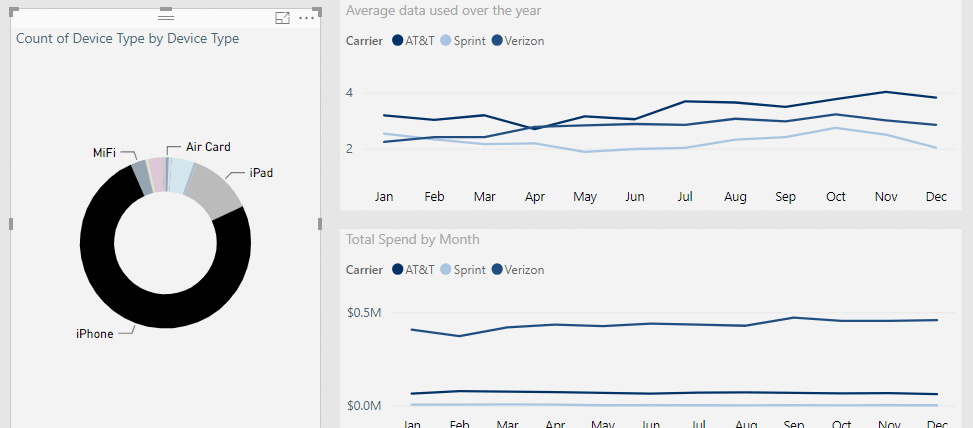
While the filter pop-up menu allows you to filter data, you can also filter data via navigation of the different charts and tables on a tab.
For Example:
If we click the section, showing the iPhone Device count on the Graph
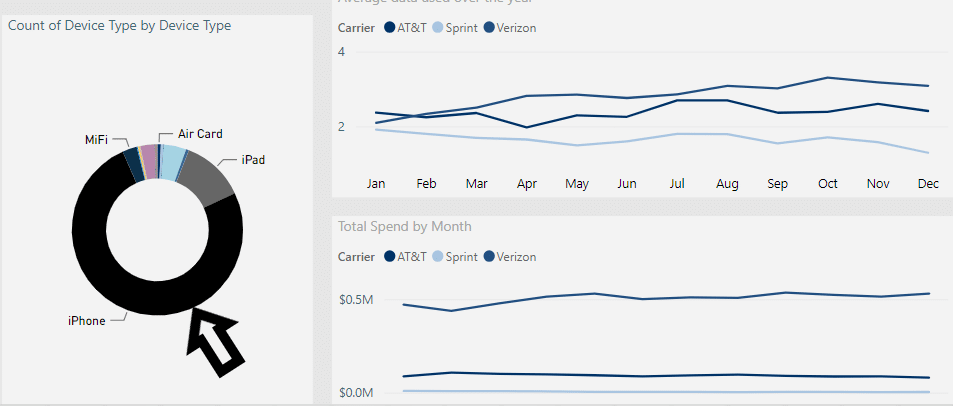
Then the Total spend and data usage charts to the left of the graph will now only show the costs and usage for your iPhones:
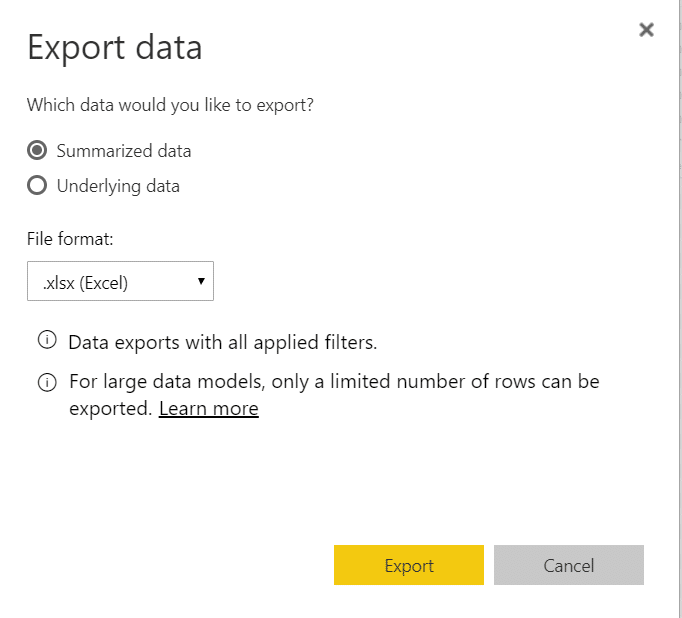
Downloading Data
In some cases, you may want to extract or download the data used in the billing analytics display.
On any chart or graph, you may click on “…” to access the more options menu (highlighted yellow below)
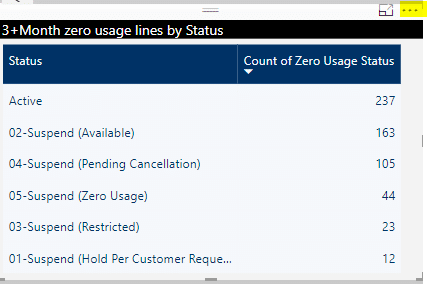
The first option will be to export data
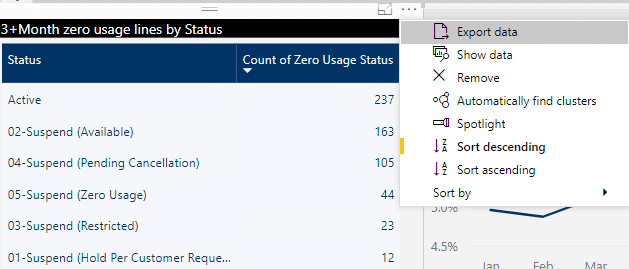
This will take you to a menu allowing to download just the data shown or all of the data attached to the chart.