Using and Navigating an MTM Billing Analytics Report
Want to download your data? Click here for directions.
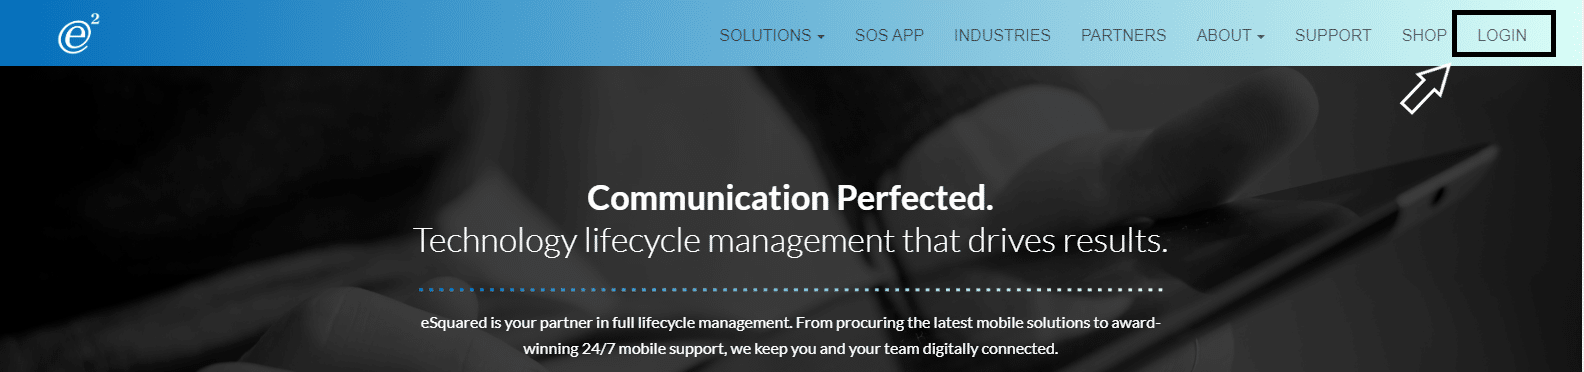
Logging into the eSquared Customer Portal
1. Go to http://www.e2cc.com/ and click on login
2. Enter email address, followed by username and password. If you are having difficulties logging in please see the following link for help: https://kb.e2cc.com/knowledge-base/esquared-customer-portal-password-reset/
3. Once in the customer portal, click on the Billing Analytics button to get to the analytics section

4. Once there click on the file to load (note in most cases you will see one file, if multiples exist they will be labeled with which division the report is for: WMS,TMS or MTM)
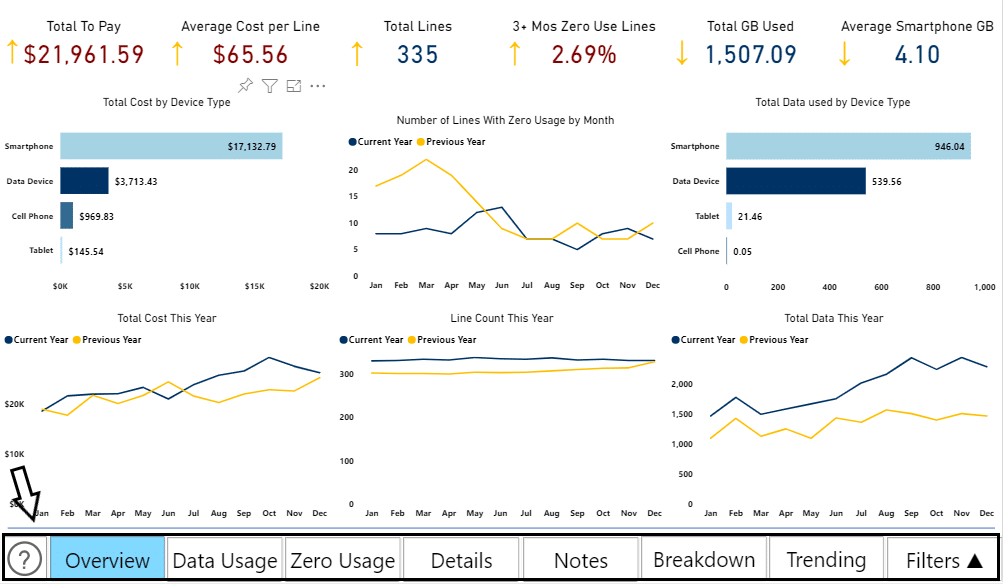
Navigating Billing Analytics
All Billing Tabs will have a few common pieces.
Navigation bar:
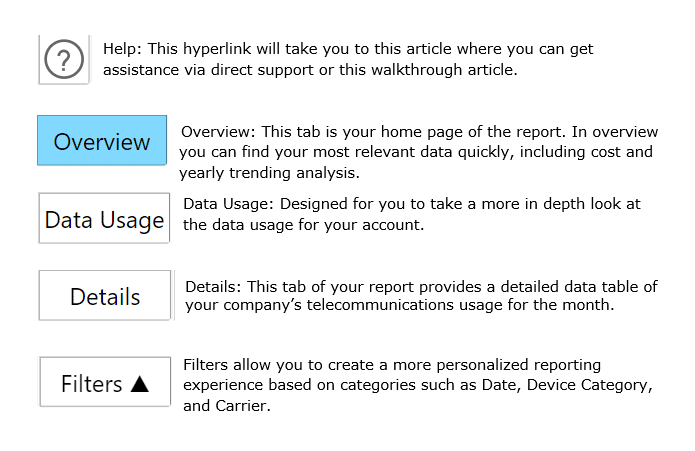
Clicking on any of the tabs will take you to the corresponding report page or pop-up menu.
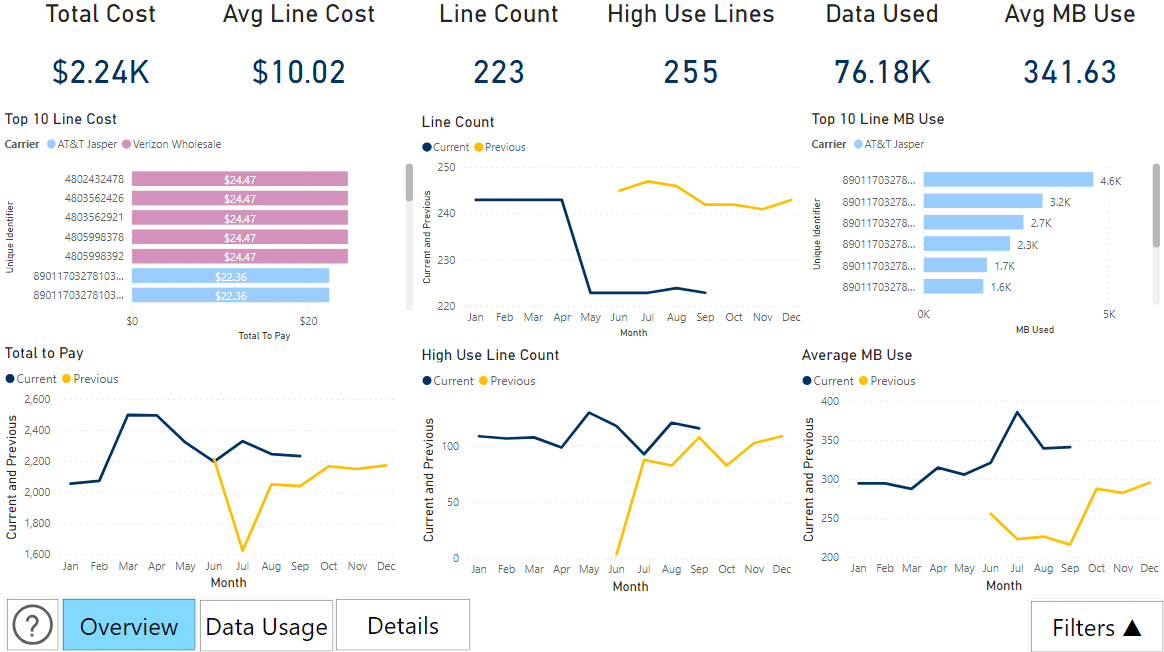
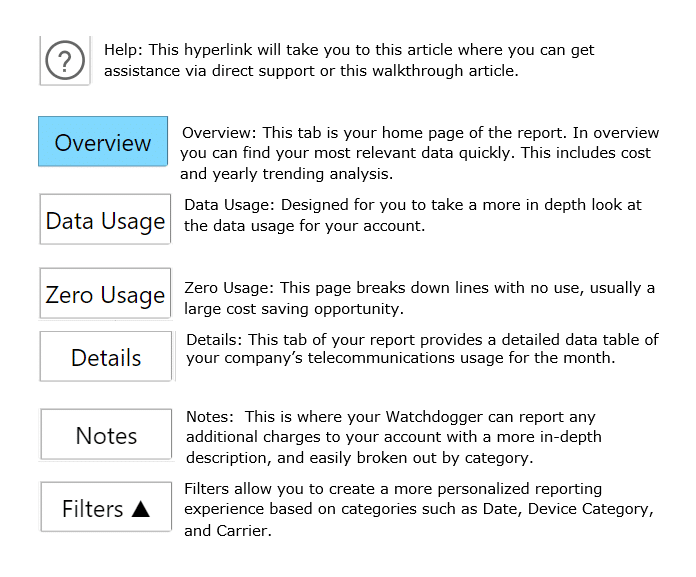
Navigation Bar Options:
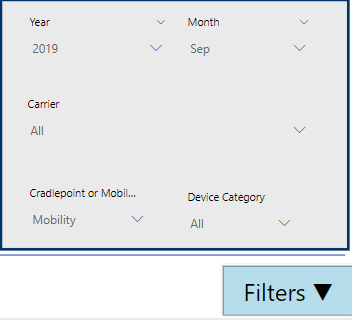
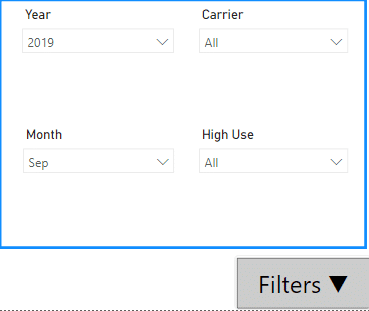
Filter Pop-up Menu:
Clicking on the Filter icon on any tab will display the filter menu, this allows you to focus data on a specific time period, device type, or carrier. Clicking on the menu again, will cause the menu to close.
Navigating the Dataset
Each tab will have different graphs and tables but most interactions between data and their tools are common throughout the report.
Filtering
While you can filter data using the Filter Pop-Out, you can also filter data interactively throughout the report, by utilizing different visualization's elements.
Example:
Let's filter MB Used Over Time by a specific user.
- If we search by a User's Unique Indetifier (IMEI or Phone Number),
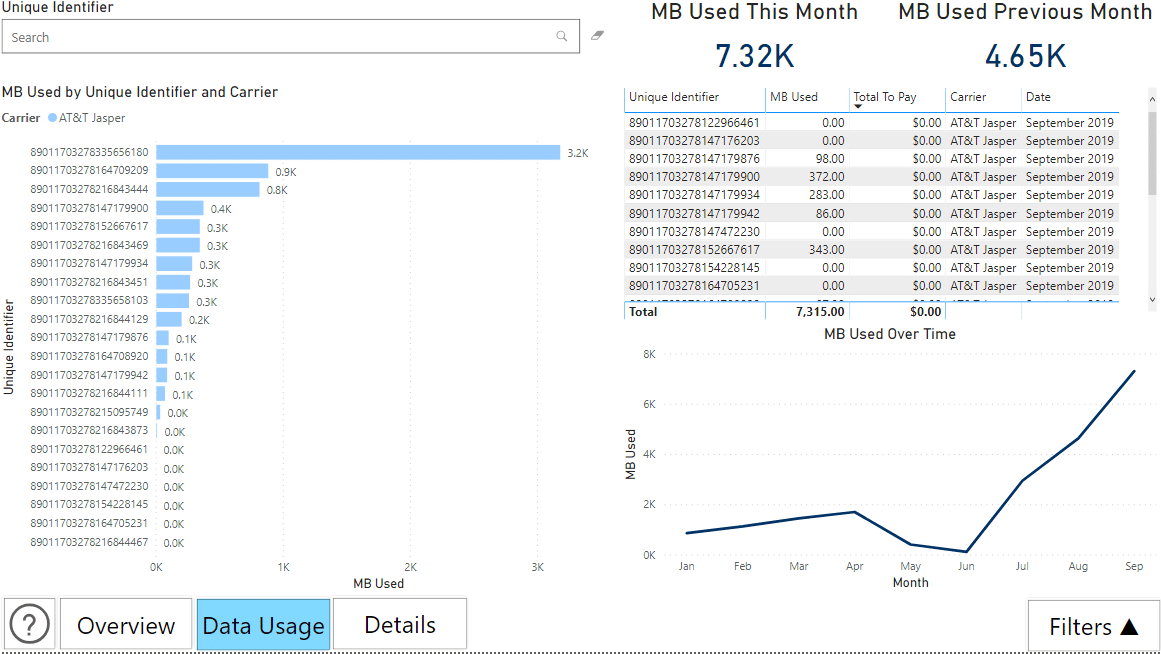
- We see that the data use line graph has now changed, representing usage solely from the specified user.
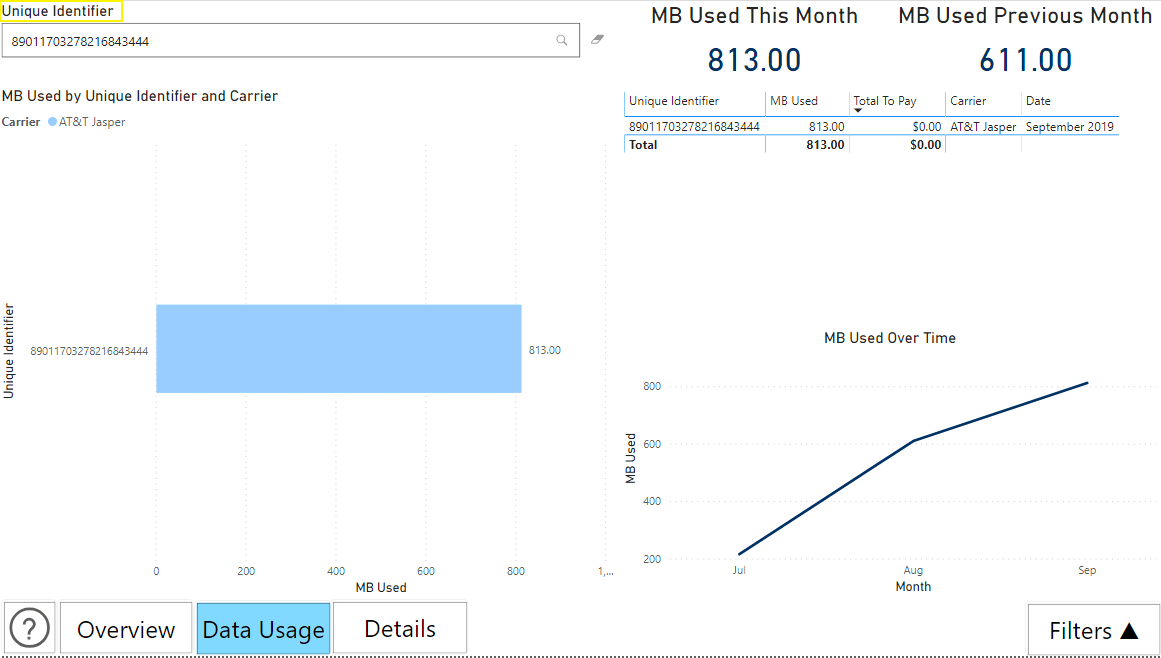
Note: All visualizations that are capable to be filtered by that user on the report would be until clearing out the search bar to reset the temporary filter.
Downloading Data
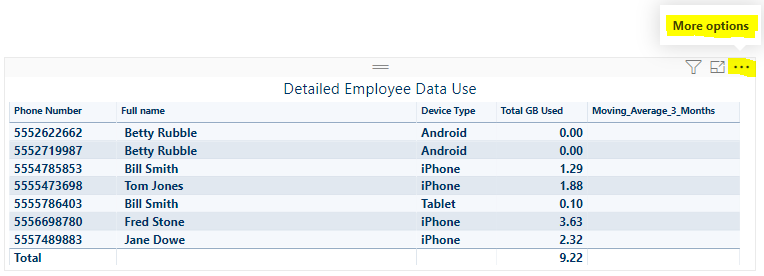
In some cases, you may want to extract or download the data used in the billing analytics display.
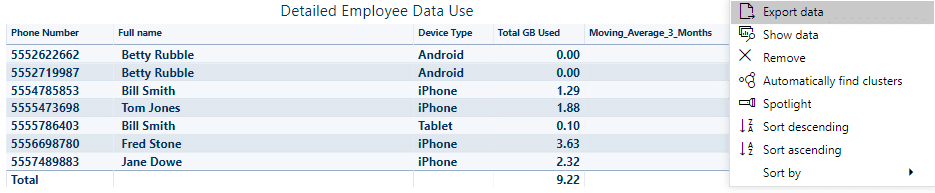
- On any chart or graph, you may click on “…” to access the more options menu.
- The first option will be to export the data.
- This will take you to a menu allowing to download either the summarized data, or the underlying data.
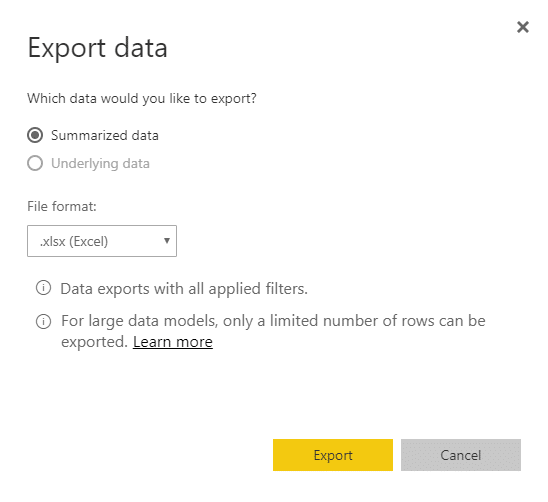
- Summarized data will give you access to only the data represented in the visualization you are attempting to download, underlying data will give you access to much more “granular” information, it is all the data we used to prepare the report.
- We recommend summarized data for Excel users not use to working with large data sets, and Underlying data for users use to larger data sets.